www.industry-vietnam.com
01
'10
Written on Modified on
COSCOM KPI module
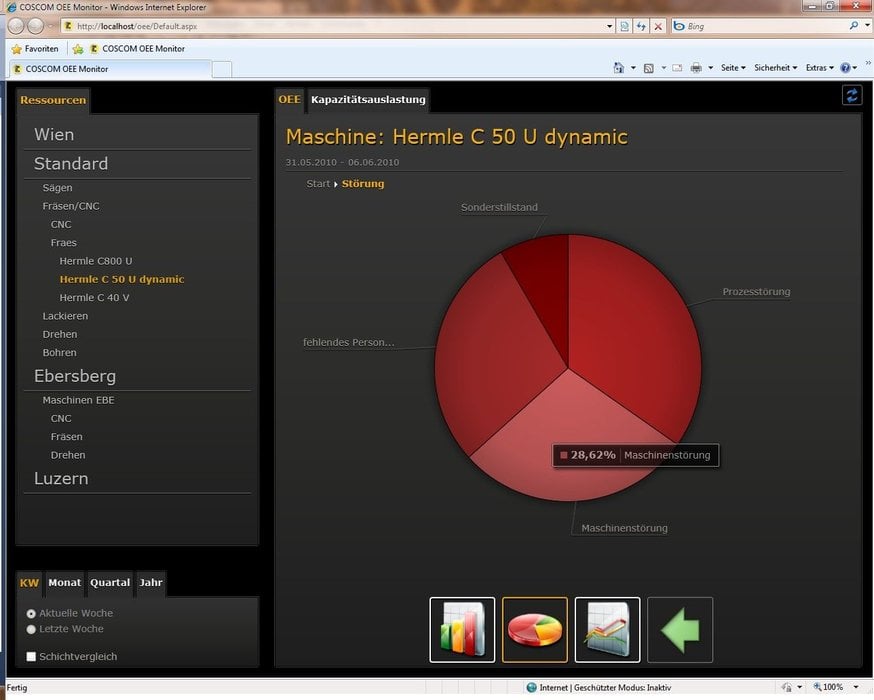
The COSCOM KPI (Key Performance Indicator) module is designed as a Web application to give users location-independent access to corporate data and analyses at all times. Online visualisation provides real-time information on the progress of the process. This allows optimisation and organisational measures to be initiated while the process is still underway.

COSCOM Computer GmbH, has more than two decades of experience in the development, marketing and implementation of software solutions for process optimisation in the production environment. The modular structure of the COSCOM MES system allows it to be used in a wide variety of applications. COSCOM software tools – ProXIA for detailed job scheduling, PEP for staff scheduling, MDE for machine data acquisition and BDE for operational data acquisition – provide the basic data for determining meaningful KPIs. They dramatically simplify the localisation of bottlenecks and negative factors in the production flow, thereby enabling users to initiate specific optimisation actions and monitor their effectiveness.
KPI analysis is becoming more and more important in the production industry. Organisational and business strategies such as lean manufacturing and kaizen pursue the essential objectives of eliminating all forms of waste, achieving customer satisfaction and delivering top quality. But what forms the basis for optimisation decisions? Experience from the implementation of real projects shows that poorly founded decisions can have a negative impact on the production process. For example, individual actions – such as reducing staff levels – can easily lead to lower productivity. Well-founded decisions are not possible unless all parties involved in the production process are forced to ‘fess up’.
Visualisation of KPIs plays a major role here. Unlike KPI analysis at the end of the production process, which only tells you whether the process was OK or not OK, online visualisation provides real-time information on the progress of the process. COSCOM’s newest product is primarily dedicated to this task. In the form of a mobile application, this module can also run on any smartphone with a Web browser, thereby enabling managers to make well-founded decisions no matter where they are – in the plant or on a business trip.
Imagery:
Caption for Mobil-300.jpg
COSCOM Mobile Monitoring runs on any smartphone with a Web browser.
Caption for Online-Monitor 1300.jpg
Keep track of orders currently being processed at various stations.
Caption for KPI_1.jpg
System status is documented and can be viewed whenever desired.
Caption for KPI_2.jpg
Powerful drill-down functions help you quickly identify the causes of production problems.

